
第十三章 顺势/逆势——双重交易方法
Trending/Anti-Trending — A Dual Market Approach
The ideal formula for investment success is the appropriate integration of a good technical system with sound principles of strategy and money management. But creating and then implementing this balance is easier said than done. During the 30 odd years that I’ve been trading, I’ve made my share of killings and had perhaps more than my share of getting killed. In my experience, the most profitable and consistent approach is a long-term positioning strategy-getting aboard in the early stage of a major move, pyramiding at the propitious time, and staying aboard for the ride. However, there is a fundamental pitfall in the way most operators handle this strategy.
投资要成功,最理想的公式就是适当地融合良好的技术交易系统,优秀的交易策略和资金管理。但是要做到这点,说起来容易做起来难。我从事商品交易30多年,曾经进场大宰别人,不过被宰的次数可能更多些。依我的经验,最赚钱和最能持续赚钱的方法,是所谓的长线仓位策略——在大趋势出现一早就进场,在有利的时机金字塔加仓,而且只要趋势持续,就继续持有仓位不动。但是大部分交易者处理这个策略时,容易跌进根本的陷阱里。
Regrettably, we are always trying to project a distinct (up or down) price trend out of every market situation. As a result, we are invariably buying on strength at what we perceive to be the bullish moment and then haphazardly selling on weakness whenever it appears to be a bearish moment. Red ink abounds on most of these trades. “How come I’m always buying on rallies and then selling on the reactions?” Does that sound familiar?
很遗憾,我们老是想在每一个市场情况中,预测明确的(上涨或下跌)价格趋势。结果我们总是在自己以为的多头时刻逢高买入,而且在以为是走空头的时刻卖到最低点。大多数交易者都亏了钱。“为什么我总是买到高价,卖到低价?”这句话是不是你的写照?
The simple truth is that markets are in relative equilibrium most of the time; that is, in a broad, random sideways range rather than a distinct up or down trending mode. A graphic example of this buy high, sell low tactic was the crude oil market for the three years from 1983 through 1985, when the market traded broadly between 26.00 and 32.00 (see Figure 13). Every rally toward 30.00-32.00 was accompanied by computer and other technical upflips, while each subsequent reaction back towards 26.00-28.00 would predictably flip everyone down.
有一个十分简单的真理,也就是市场大部分时间都相当平衡:换句话说,是处在一个宽幅震荡的漫无目标的区间内,没有明显的上涨或下跌趋势。我们拿一张图来说明1983——1985年3年内原油市场买高卖低的例子。那时候,市场是在26.00到32.00的宽广区间内上下浮沉(见图13-1)。每一次反弹冲向30.00——32.00,总是会使电脑和其它的技术指标反转向上,每一次接踵而来跌回26.00——28.00,指标又会变成反转向下。
图13-1 原油(最近期)长期周线图 (文字:耐心终于得到回报)
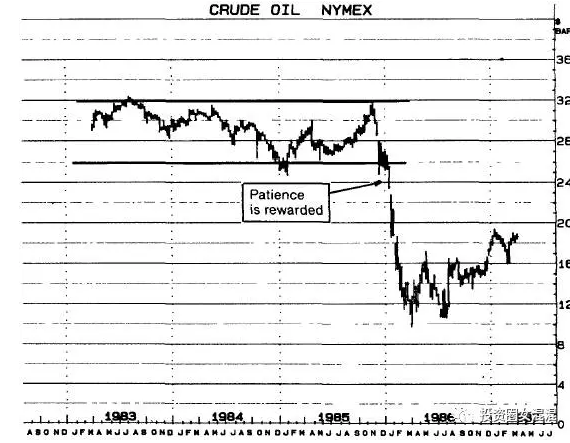
【For the three-year period, 1983-85, crude oil traded in a broad sideways range bounded by 26.00 to 32.00. Long-term position traders were whipsawed as their systems kept giving buy signals on the rallies towards the upper boundary of the range and sell signals on reactions toward the lower boundary. Their patience was finally rewarded, however, in January of 1986, when the market broke down through the bottom of the trading range and continued south till it reached the 11.00 level. This points out the need for consistent adherence to all trading signals because the one big profit on the early January down-leg exceeded the string of small losses during the sideways trading range.
1983——1985年,原油在26.00到32.00的宽幅区间内起伏。长线仓位交易者的系统每当市价涨向区间上档,就发出买入信号,跌到下档又发出卖出信号,结果长线仓位交易者惨遭洗盘。但是他们的耐心终于得到回报。1986年1月,市场跌破区间底部并继续下滑到11.00。这里要说明的一点是:你一定要始终如一遵守所有的交易信号,因为1月初下跌段的大利润超过市场横向盘整期间一连串的小损失。】
As a viable alternative to this “oops” method of trading and after years of probing and testing, making more mistakes than I care to recall, I have developed a dual trading approach to speculation. It can be summarized as follows: During periods of broad, 四sideways price movement, you play an essentially game-buying on reactions towards the lower boundary of the trading range and selling on rallies towards the upper boundary. However, once the market blast out of this broad sideways formation-in either direction-you abandon the antitrending position and follow the breakout strength (see Figures 13-2 and 13-3).
经过多年的摸索和测试,犯了不计其数的错误,我找到了一种双重投机交易的可靠方法,代替这种“喔,完蛋了”的交易方法,摘要如下:价格处于宽广的横向盘整期,你可以玩一种基本上叫做反趋势交易的游戏——价格回调到交易区间的下档时买入,反弹到上档时卖出。但是一旦市场跳出这个横向盘整时——不管是往哪个方向——就要舍弃反趋势交易所建的仓位,顺着突破所显现的强势方向建仓(见图13-2和13-3)。
图13-2 1987年6月国库券 (文字:由多转空)
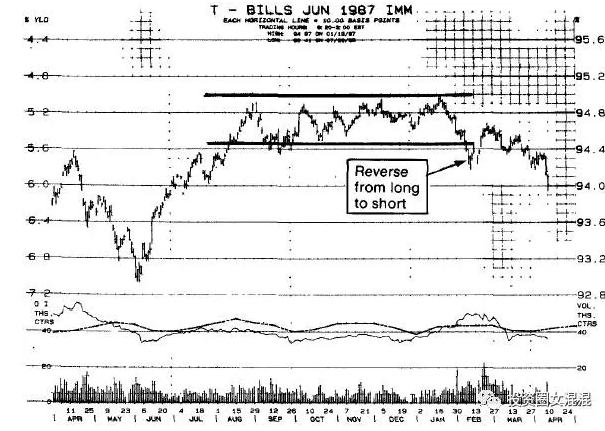
【The market was locked within a broad sideways trading range (94.45 to 95.00) for the six-month period, August 1986 through January 1987. During this sideways period, you would play antitrend, looking to place shorts against the 95.00 upper boundary and to cover shorts and go long against the 94.45 lower boundary. These antitrend positions would be protected with stops on close only, just beyond the trading range (at 94.35 stop close and 95.10 stop close). On a closing breakout in either direction, you would liquidate your antitrending position and assume a new trending position. On February 10, the market broke down, with June closing at 94.31. On the close, the position would have been reversed from long to short.
1986年8月——1987年1月,6个月的期间内,市场锁定在宽广的区间内(94.45——95.00)。这段期间,你可以反趋势交易,在95.00的上档附近做空,94.45的下档附近平仓并做多。这些反趋势仓位只会用收盘止损点来保护。止损点设在区间外不远处(94.35收盘止损和95.10收盘止损)。收盘价不管往哪个方向突破,你都要平掉反趋势仓位,建立新的顺势仓位。2月10日市场突破向下,6月期货以94.31收盘。收盘时他们应该反向交易,由多转空。】
图13-3 咖啡豆(最近期)长期周线图 (文字:注意!行情来了)
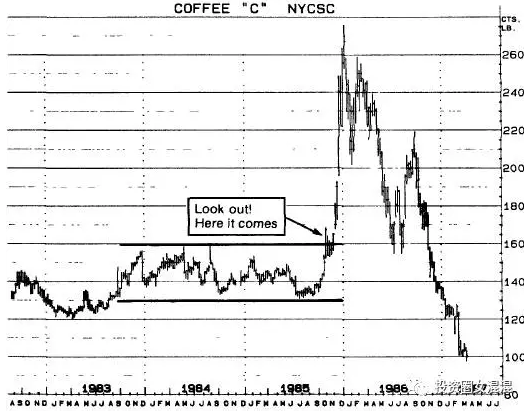
【The market traded within a sideways range (130.00 to 160.00) for 27 months, from July 1983 through October 1985. You should have played this antitrend, going short against the 160.00 upper boundary and reversing to long against the 130.00 lower boundary. These antitrend positions would have been protected with on close only stops, just beyond the trading range, around 127.00 and 163.00. Following several successful antitrend trades, the market broke out on the upside in October 1985. The short position would have been liquidated, and a with-the-trend long position would have been taken.
从1983年7月——1985年10月,市场横盘盘整(130.00——160.00)达27个月之久。在这种市场中,你应该用反趋势交易方法,于160.00接近上档时做空,跌到130.00下档时反转做多。这种逆势仓位只用收盘止损来保护,设在交易区间外不远处,也就是在127.00和163.00附近。经过几次成功的逆势交易之后,市场终于在1985年10月往上突破,这时空头仓要平掉,建立顺势而为的多头仓。】
This approach is logical and straightforward, with no fancy “bells and whistles,” as in so many of the current systems and trading theories. Here is an optimum market approach, coordinated into two aspects-the technical trading system and the investment strategy. When followed in a serious and disciplined manner, by either a speculator, trade hedger, or financial institution, it could yield consistent market profits within an acceptable risk environment. It constitutes the game plan for many successful professional operators, who may keep their winning strategies to themselves but whose profitable results are highly acclaimed.
这个方法可说是合情合理且直截了当,不像很多当代的系统和交易理论那样有迷人的“买卖信号声”。最适当的交易方法应当融合两个层面——技术交易系统和投资策略。不管是投机者,交易避险者或者金融机构,以严肃和有纪律的态度来遵守时,便能在可接受的风险环境中,得到经常性的市场利润。对很多成功的专业交易者来说,这些是游戏计划中非常重要的一部分。这些人对自己赢的策略进行保密,但他们的利润却透露了一切。
To implement the strategy, you start by identifying the price trend of each market as sideways or trending (up or down).
要执行这个策略,先得确定每个市场的价格趋势是横向盘整,还是有明显的趋势(上涨或下跌)。
How do you identify the trend as being sideways or trending? I usually do it by inspection, studying both the daily and the weekly charts for each commodity under review. A discussion regarding trend identification is not within the scope of this book, but there are good reference sources available. A more objective method of trend identification is through the use of some available formula, and the best I have seen is Wilder’s Directional Movement Index. This index measures, on a scale between 0 and 100, the extent to which any market is trending. Values in the upper end of the scale indicate a strong trending market, while lower values accompany nontrending (sideways) markets. The index also defines and identifies an equilibrium point, where directional movement up is just equal to directional movement down. You can calculate these values by hand, but it is more efficient to use either a programmable calculator, such as one of the Hewlett Packards, or a microcomputer (Apple, IBM, or a compatible). Information concerning software packages is available from Trend Research, Ltd (J. Welles Wilder, Jr., New Concepts In Technwal Trading Systems (Mcleansville, N.C. 27301: Trend Research, 1978).).
那你要怎么确定趋势是横向盘整还是有明显的趋势?我通常是拿想要了解的商品的日线图和周线图仔细探究和研判。本书并不讨论要怎么样找趋势,这方面的参考书籍汗牛充栋。确认趋势一个比较客观的方法,是利用一些现成的公式,其中我见到最好的一种,是怀尔德的“方向运动指数”。这个指数用0到100的量数衡量新市场形成趋势的程度,数值越大表示趋势越强,数值越小则越趋近于没有趋势的市场(横盘盘整)。这个指数也定义和确认平衡点,也就是向上运动等于向下运动的地方。你可以用笔算出这些数值,但是利用可编程计算器,像是惠普公司的产品,或者电脑,速度会更快。这方面的软件可找趋势研究公司购买。
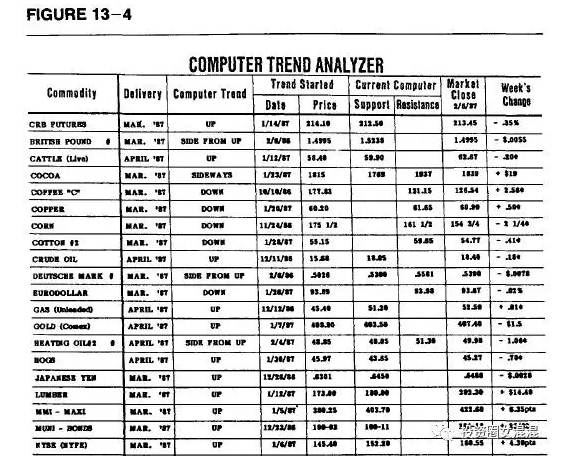
The other approach to trend identification is via a subscription to one of the commercial services which provides this information on a daily or weekly basis. For several years, I have used the Computer Trend Analyzer, contained in the weekly CRB Futures Chart Service (see Figure 13-4). This technical method is based on mathematical calculations of price movements, which include moving averages, volatility, oscillators, and time cycles. The weekly service is actually an offshoot of CRB’s daily Electronic Trend Analyzer, which includes trend identification plus other technical information for some 200 futures contracts. As you can see from Figure 13-4, the Computer Trend Analyzer identifies the trend of each market as sideways, up or down. For each sideways market, it identifies the support and resistance levels. A close below the indicated support price will flip the trend to down, and a close above the indicated resistance price will flip the trend to up. Furthermore, in the case of up- or down-trending markets, the Analyzer indicates where an up market flips to side (price closes below the indicated support price) and where a down market flips to side (price closes above the indicated resistance price).
确认趋势的另一个方法,是向能够提供每日或每周信息的公司购买服务。多年来,我都是利用电脑趋势分析表。这个表可以在商品研究局期货服务每周出版品中找到(见图13-4)。这个技术方法是用数学公式算出各种价格运动数值,包括移动平均数、波动性、振荡量和时间周期。这张每周送一次的报表其实是商品研究局每天的电子趋势分析表衍生出来的另一个服务,其中还包括找出约200种期货合约的趋势和其它技术信息。从图13-4看得出来,电脑趋势分析表确认了每一个市场是走横盘盘整,上涨还是下跌。对于每一个横向盘整市场,它找出了支撑点和阻力点。收盘价如果低于所指出的支撑点,趋势就会反转向下,收盘高于所指出的阻力点,趋势就会反转上涨。此外,这份分析表指出了上涨趋势市场何时反转成横盘(收盘价低于所指出的支撑点),以及下跌趋势市场何时反转成横盘(收盘价高于所指出的阻力点)。
图 13-4
For each sideways market, you identify the following:
对于每一个横向盘整,你要确认以下的事情:
1. The upper and lower boundaries of the SIDEWAYS formation.
1. 盘整区上档和下档;
2. The price levels (“exit trade”) where, on a closing basis, the trend will have changed from sideways to up (upside breakout) or from sideways to down (downside breakout).
2. 以收盘价来看,价格水准(出场点)在哪里从横盘改为上涨(向上突破)或者从横盘改为向下(向下突破)。
These exit trade (stop) points where you close out your antitrend position and put on a trending position will be beyond the boundaries of the sideways trading range. The buy stop, to exit your short antitrend position, will be above the upper boundary of the trading range. The sell stop, to exit your long antitrend position, will be below the lower boundary. How much above and below? That is, obviously, the trickiest part of the operation because, if the stop is too close you will be excessively whipsawed; if the stop is too far, you will be taking some whopping losses. You should consider the total loss you are willing to take on the position. Then set your stop at the point beyond your trade entry point that would limit the loss to this sum. For an example, if you are trading soybeans and have set a risk limit of, say, $600 (12 cents), you would set your sell stop (for a long position) 12 cents below your buy price and your buy stop (for a short position) 12 cents above your sell price. Take the case of March 1987 soybeans (Figure 13-5). They are trading in a broad sideways range between 4.80 and 5.10, with the current market at 4.89. You would be interested in buying around 4.86 with a sell stop at 4.74 (12 cent risk). Or you could go short around 5.04 with a buy stop at 5.16 (again, 12 cent risk).
这些出场点(止损点)指出了你该平掉逆势仓,建立顺势仓的地方,是在横向盘整区间之外。退出逆势空头仓的买入止损点,是在交易区间的上档之上。退出逆势多头仓的卖出止损点,是在下档下方。那要多出多少?很明显的,这是交易过程中最难以琢磨的地方,因为如果止损点摆得太近,他会整天到晚交易个不停,发生太多次平仓损失;如果放得太远,你又会来不及逃生,而发生巨大的亏损。设立止损点的时候,应该先考虑自己愿意在所建仓位上承担多少的总损失,再看你进场点在哪里,止损点就设在万一发生损失,损失金额等于自己愿意承担的总损失的地方。比如说,如果你交易的是黄豆,自行设定的风险总额是600元(合12分),那么卖出止损点(适用于多头仓的状况)则设在买价以下12分处,买入止损点(适用于空头仓的情况)则设在卖价以上12分处。以1997年3月的黄豆市场为例来说(图13-5),是在4.80到5.10间横向盘整,目前市价是4.89,你可能有兴趣在4.86附近买入,但是卖出止损点要设在4.74(风险12分)。或者,你可能想在5.04附近做空,这时买入止损点要设在5.16(同样是12分的风险)。
图13-5 1987年3月黄豆 (文字:宽幅震荡的横向交易区间)
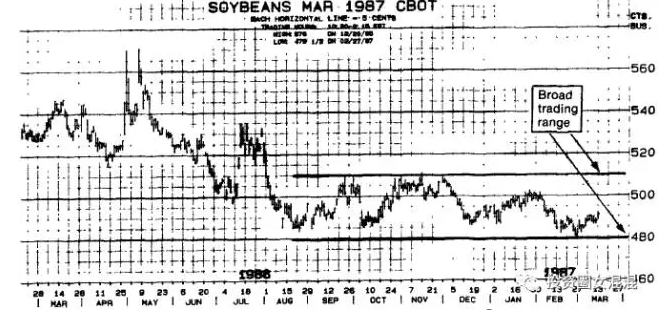
【The market is trading within a broad range bounded by 4.80 and 5.10. So long as it remains within this range, we play antitrend. We buy on reactions to 4.86 and sell on rallies to 5.04. On a close above 5.16 the trend will reverse from side to up, and we cover shorts and reverse to long. On a close below 4.74 the trend will reverse from side to down, and we liquidate longs and reverse to short.
市场在4.80——5.10的宽广交易区间内浮沉,只要价格仍在这个区间内,我们就可逆势交易,也就是回调到4.86买入,反弹到5.04卖出。收盘价如果高于5.16,趋势会由平翻涨,这时我们就平仓,改做多。收盘如低于4.74,趋势则会由平翻跌,这时我们就平掉多头仓,改做空。】
In terms of liquidating the position, I would take the trade one stop further by setting my protective stops as stop and reverse. If the market were to close at my buy or sell stop, each of which is 6 cents beyond the limit of the trading range, I would want to reverse to the respective trending position. If I had sold 10M short at 5.04, I would buy 20M at 5.16 stop on close. If I had bought 10M at 4.86, I would sell 20M at 4.74 stop on close.
谈到平仓交易,我个人不但是把止损点当做平仓点而已,还会在这里反向交易。如果市场收盘价到达我的买入或卖出止损点(各在交易区间外6分的地方),我会改建顺势仓。如果我在5.04做空1000万,那么收盘5.16的止损点处会买回2000万。如果我本来是在4.86处买入1000万,则会在收盘4.74的止损点卖出2000万。
However, if the position goes your way, since you are trading antitrend, you will liquidate and reverse at the opposite side of the trading range. If you had sold 10M March beans on strength at 5.04 and the market started heading south, you would buy 20M at 4.86. Conversely, if your first trade was a buy against the lower boundary at 4.86 and the market rallied, you would sell 20M at 5.04.
但是,如果仓位果如你所愿,由于你是逆势交易,那么在交易区间的另一端,你必须平仓并反向交易。如果你见高在5.04卖出1000万,而市场开始下跌,你必须在4.86买入2000万。相反,如果你的第一笔交易是在低档附近的4.86买入,而市场随后反弹,那你必须在5.04卖出2000万。
The strategic aspects of this operation dictate that, while trading antitrend, your stops are stop and reverse. Also, they are on close only. You do not want to be stopped and reversed by some random intraday jump outside the trading range, only to find that by the close the price may have returned back within the range.
这种交易的策略而在于,虽然交易是逆势而为,但是市场一旦达到你的止损点,你一定要停止原来的做法,改为顺势交易。同样的,只有在收盘价达到止损点的时候这样做,因为我们都不希望盘中随意的价格波动,只要一跳出交易区间,就发动止损交易,等到收盘时却发现价格又回到原来的区间内。
In terms of how to exit a trending position, you will do this through being stopped out-whether at a profit or a loss. Your initial stop on a trending position should be placed to limit your loss to an acceptable amount, perhaps to 80 to 100 percent of the margin requirements (or less, if that is excessive). If the market does move favorably, you are still faced with the problem of exiting this (profitable) position. Experience has shown that there is no viable and consistent way for you to pick off major tops and bottoms. All of us have had the frustrating experience of dumping a favorable with-the-trend position prematurely. Therefore, it makes good sense to sit with the position until the market takes you out. You do this by setting efficient stops, advancing them as the market moves favorably, until you are ultimately stopped out.
谈到如何退出顺势的仓位时,我们还是利用止损点——不管是赚是亏,一到止损就出场。顺势仓初步的止损点是设在你所能接受的亏损处,也许是需缴保证金的80%到100%(如果你觉得这个金额多了些,也可以设低一点)。如果市场对你有利(赚钱),你还是要面对退出仓位的问题。经验显示你找不到可行和永远可靠的方法以卖到最高点和买到最低点。我们都有过令人泄气的经验,一大早就卖出赚钱的顺势仓。因此,不妨坐等市场自动把你带出场。设定有效率的止损点,也就是随着市场对你有利的趋势,不断亦步亦趋挪动你的止损点。直到最后碰到止损点出场为止。
Being stopped out of a trending position (here, you stop out intraday rather than on close) does not necessarily mean that the trend has reversed. It may just mean that you reached your pain threshold and you deemed it prudent to cut losses or to preserve part of your profit. Use a straight liquidating stop, not a reversal stop. Assuming that the major trend had not changed, you can always reenter the market at a more propitious time.
顺势仓止损出场(这里所说的是盘中触及止损点,而不是收盘才止损出场)时,不一定表示趋势已经反转,那可能只是表示你已到痛苦的极限,你只好止损,或者是保存部分的利润。你最好是用单纯的平仓止损,不要用反转止损。也就是说你要默认大趋势并没有改变,你一定有机会在有利的时机再进场。
Although the dual trend/antitrend strategy is logical, it may be emotionally difficult to stick with. Considering the volatility of many markets, it really takes a strong constitution to play this successfully. We ought to examine why there is such a compelling temptation on the part of many speculators to buy near the top of a broad sideways trading range and to sell near the bottom. It is largely a matter of “crowd perception,” for markets invariably speculative buying on strength and selling on weakness during seem most bullish on the rallies and most bearish on the reactions. As a market surges towards the top of a broad sideways range, there will be lots of bullish news and rumors and higher price expectations, accompanied by broad speculative buying. After all, no one wants to miss the start of the big “bull express.” This would probably turn out alright if we were talking about buying into a bullish trending market or selling into a bearish trending market. But, since most markets move in a sideways random direction most of the time, this “buy high and sell low” approach is invariably the wrong way to play. In fact, much of the sideways nontrends is played to advantage by professional operators who unload their positions held from better levels.
虽然这种双重顺势/逆势交易策略很合乎逻辑,但是感情上可能很难遵守。以很多市场激烈的波动特性来看,玩这种策略要成功,必须有很强的心脏不可。我们必须检查一下,为什么会有那么大的诱惑力,吸引那么多投机者在宽广的横向盘整区间的高档买入,又在低档卖出。个中原因主要是“群众效应”造成的,因为市场反弹的时候,大家总是弥漫看多头的气氛,等到回调,大家又弥漫着看跌的情绪。价格冲向宽广的横向盘整区间的高档时,市场总会充斥着很多利好消息和传闻,市场人士总预测价格会涨得更高,同时投机性买盘随处可见。毕竟,没人希望错过多头快车的起站。如果我们是在多头趋势市场买入,或者是在空头趋势市场卖出,那么到头来可能证明我们是对的。但是由于市场大部分时候都是漫无目标呈现横盘,这种逢高买入和逢低卖出的策略,往往是个不对的做法。事实上,在没有趋势的横盘里,逢高投机性买入和见低卖出的做法,刚好给专业交易者脱手的机会,因为他们已经在更好的价位建立了仓位。
I recently talked to a Washington-based international banker, who had spent the morning with a senior bond trader at one of the large money-center banks. “Imagine,” he gasped, “the guy buys $100 million bonds in the morning and then dumps the position before lunch. The loss was $100,000 and nobody batted an eye.”
最近我跟华盛顿一位国际银行家谈过话。这个人早上刚跟某大货币中心银行的资深债券交易者见过面。“你知不知道,”他喘了一口大气,“那位老兄早上敲进了1亿元债券,午饭前又平仓,损失了100000元,没眨一下眼睛。”
Clearly the banks, commercial dealers, big institutions, and floor operators play a dynamic and broad-swinging game – big orders, big positions, for big dollars. The result is big profits and losses, but even bigger swings and volatility. And, since their orientation is essentially short-term, we longer-term position traders find it increasingly difficult to stick with our prescribed holding strategies. We are, all too often, mauled in the crossfire between the big professional or commercial houses and the heavy concentration of commission firm and commodity fund stop orders that are frequently used as “target practice” by professional operators.
很明显的,这种银行、商业自营商、大机构和现场交易者,都是大手笔来回进出的人——他们下的是大订单、庞大的仓位、进出都是大金额。因此,赚的时候是大赚,亏的时候是大亏,但会造成市场波动更激烈,更猛。由于他们做的都是短线,我们这些长线的仓位交易者,就很难坚守自己既定的持有仓位的策略。在专业交易大户、商业经纪,经纪行和商品基金利用止损做实战的火拼中,我们也会无辜受伤。
There isn’t much you can do to prevent these massive whipsaw moves. But you can minimize the damage by taking smaller positions and trading less frequently. Also, try to avoid buying strength and selling weakness in broad sideways trends, since these are the typical speculator traps set up by the major players.
要防止这种庞大的洗盘,我们能做的并不多。但是你可以通过建立小仓位,减少交易频率的方法把损失降到最低。同样的,我们不要在宽幅的横盘盘整中高买低卖,因为这通常是大户给投机者设下的陷阱。
The dual trend/antitrend strategy, if used correctly and in an objective and disciplined manner, should considerably improve your overall trading results.
双重顺势/逆势交易策略如何运用得对,而且能够保持客观和严守纪律的态度,应该可以大幅提升你的整体交易成绩。
方向不对,努力白费!
《赢乐-通向财富自由之路》第五期即将开课啦!

(点击图片查看详情)

每日精彩,欢迎扫描二维码关注期乐会微信公众平台。
感谢作者辛苦创作,部分文章若涉及版权问题,敬请联系我们。
纠错、投稿、商务合作等请联系邮箱:287472878@qq.com
